Source: Centers for Disease Control and Prevention (Updated February 16, 2021)
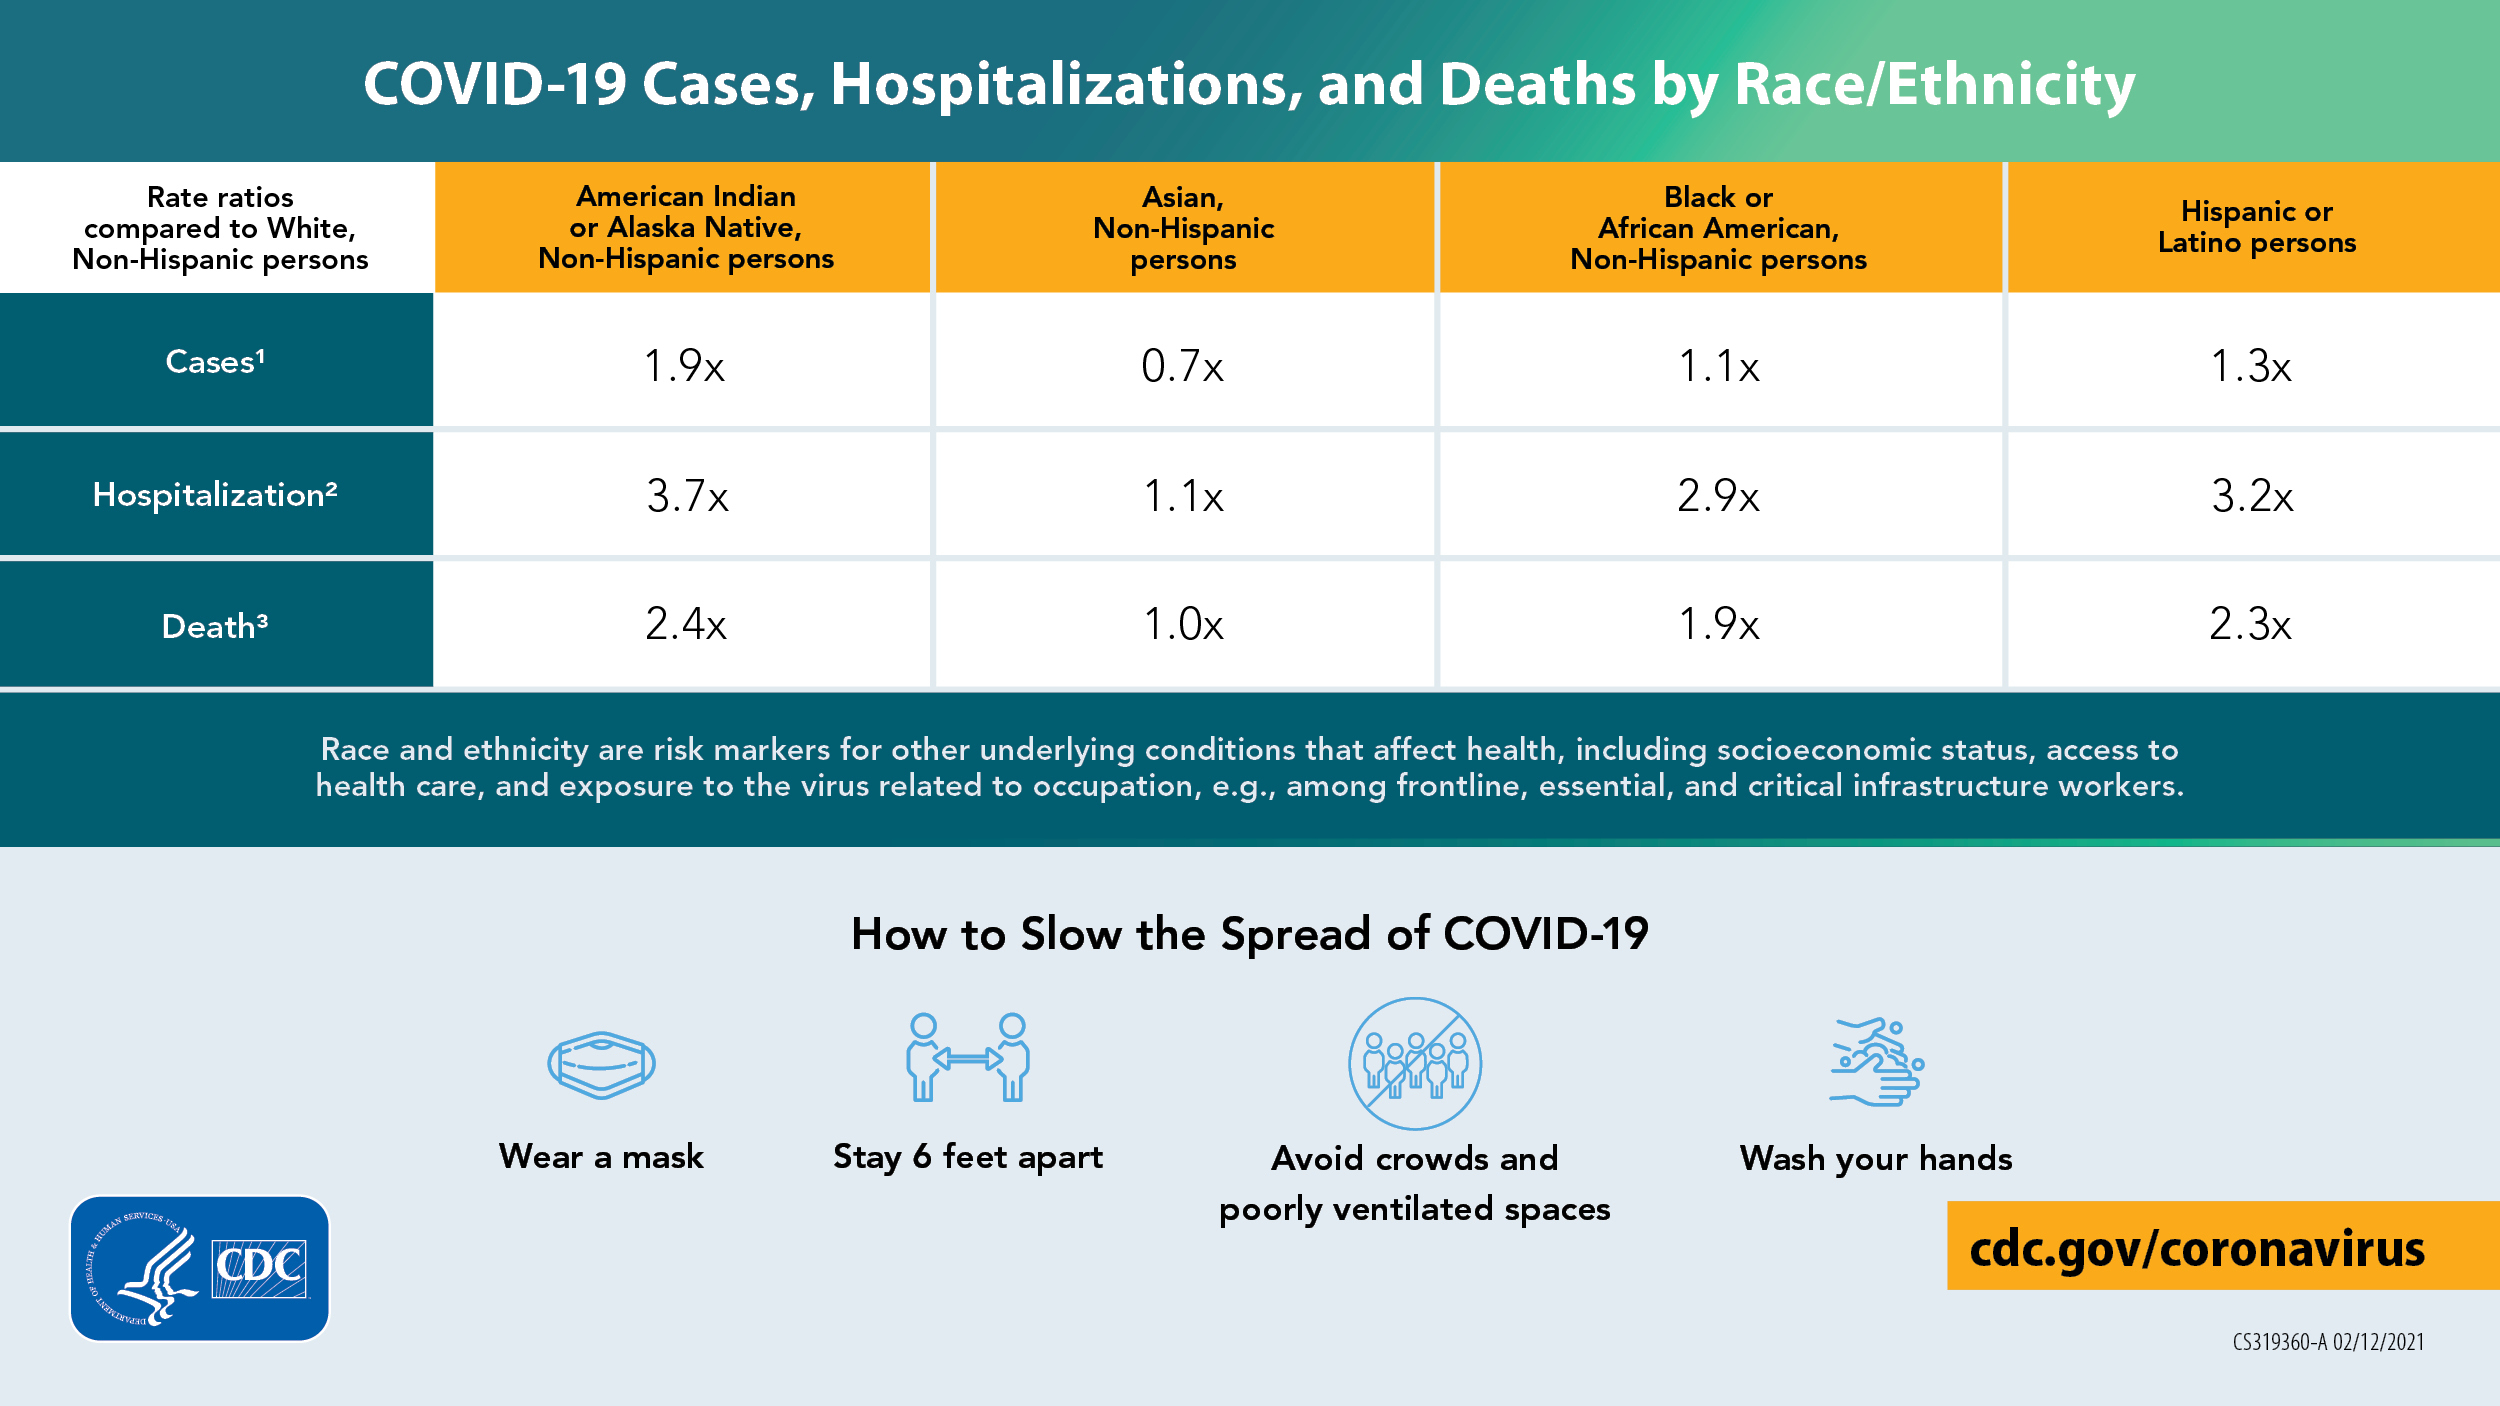
Infographic presenting table of COVID-19 Cases, Hospitalizations, and Deaths, by Race/Ethnicity.
Updated February 16, 2021
Source: Centers for Disease Control and Prevention
As of February 1, 2021, compared to non-Hispanic White persons, age-adjusted case rates reported by state and territorial jurisdictions were:
- 1.9 times higher among American Indian or Alaska Native, Non-Hispanic persons
- 0.7 times lower among Asian, Non-Hispanic persons
- 1.1 times higher among Black or African American, Non-Hispanic persons
- 1.3 times higher among Hispanic or Latino persons.
As of January 30, 2021, compared to non-Hispanic White persons, age-adjusted hospitalization rates were:
- 3.7 times higher among American Indian or Alaska Native, Non-Hispanic persons
- 1.1 times higher among Asian, Non-Hispanic persons
- 2.9 times higher among Black or African American, Non-Hispanic persons
- 3.2 times higher among Hispanic or Latino persons.
As of January 30, 2021, compared to non-Hispanic White persons, age-adjusted death rates were:
- 2.4 times higher among American Indian or Alaska Native, Non-Hispanic persons
- The same for Asian, Non-Hispanic persons
- 1.9 times higher among Black or African American, Non-Hispanic persons
- 2.3 times higher among Hispanic or Latino persons
Race and ethnicity are risk markers for other underlying conditions that affect health, including socioeconomic status, access to health care, and exposure to the virus related to occupation, e.g., among frontline, essential, and critical infrastructure workers.
How to slow the spread of COVID-19: 1) Wear a mask, 2) stay at least 6 feet apart, 3) avoid crowds and poorly ventilated spaces, 4) wash your hands.
- Data Source: Data reported by state and territorial jurisdictions (accessed 02/01/2021). Numbers are ratios of age-adjusted rates standardized to the 2019 US intercensal population estimate. Calculations use only the 51% of case reports that have race and ethnicity data available; this can result in inaccurate estimates of the relative risk among groups.
- Data Source: COVID-NET (https://www.cdc.gov/coronavirus/2019-ncov/covid-data/covid-net/purpose-methods.html, accessed March 1, 2020, through January 30, 2021). Numbers are ratios of age-adjusted rates standardized to the 2019 US standard COVID-NET catchment population.
- Data Source: National Center for Health Statistics (NCHS) provisional death counts (https://data.cdc.gov/NCHS/Deaths-involving-coronavirus-disease-2019-COVID-19/ks3g-spdg, data through January 30, 2021). Numbers are ratios of age-adjusted rates standardized to the 2019 US intercensal population estimate.

Indian Health Service Announces New Deputy Director for Quality Health Care and Enterprise Risk Management (Indian Health Service)
Federal Emergency Management Agency (FEMA)
White House Office of Management and Budget (Joe Biden Administration)
Tuba City Regional Health Care Corporation (Arizona, Navajo Nation)
Oklahoma City Indian Clinic (OKCIC)
Indian Health Service (Department of Health and Human Services)
Navajo Nation Town Hall (Arizona, New Mexico, Utah)
Navajo Nation (Arizona, New Mexico, Utah)
Tribal organizations statement on advance appropriations for Indian Health Service
Indian Health Service Statement on Advance Appropriations (Department of Health and Human Services)
Indian Health Service (Department of Health and Human Services)
Indian Health Service (Department of Health and Human Services)
Navajo Nation (Arizona, New Mexico, Utah)
Indian Health Service (Department of Health and Human Services)