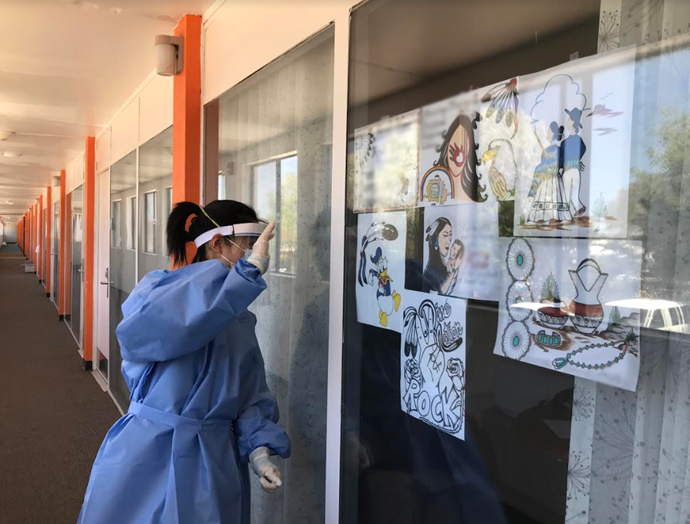
Indian Health Service Internal Medicine Chief Clinical Consultant Dr. Jennie Wei is seen visiting patients at a hotel isolation site in Gallup, New Mexico. Photo: Indian Health Service
The Indian Health Service has updated its coronavirus data, showing COVID-19 vaccination distribution and administration as of June 7, 2021.
According to the data, the IHS has distributed 1,748,665 COVID-19 vaccine doses across 11 areas of Indian Country. Of that amount, 1,387,826 have been administered, representing nearly 79.4 percent of the total.
The number of vaccines distributed increased by almost 0.7 percent from the week prior, according to the figures. The number of vaccines administered increased by nearly 1.2 percent.
The data shows the Oklahoma City Area has received the largest number of vaccines. The 440,160 doses account for about 25.2 percent of the total. Of that amount, almost 80.4 percent have been administered in the region.
With 249,605 doses distributed, the Navajo Area comes in second, accounting for nearly 14.3 percent of the total across the IHS. Of those, almost 89 percent have been administered in the region.
In March 2020, the Gallup Indian Medical Center began identifying options for safe #COVID19 isolation spaces. With the incredible collaboration of multiple organizations, this led to the opening of the first hotel isolation site in New Mexico. Read more: https://t.co/o6nJnuFyKV pic.twitter.com/9h0GTZsxB2
— IndianHealthService (@IHSgov) June 9, 2021
According to the IHS, vaccination distribution and administration will be updated weekly across the 11 areas that are receiving doses directly from the agency.
Tribal health facilities in Alaska have chosen to receive their COVID-19 vaccine supplies from the state, so their region is not included in the data.
COVID-19 Vaccine Distribution and Administration by IHS Area
As of June 7, 2021, the IHS is distributing vaccine allocations of the Pfizer, Moderna, and Johnson & Johnson/Janssen vaccine. The table below shows the total number of vaccine doses distributed and administered per IHS Area to date. The overall administration rate for the IHS jurisdiction is 79 percent however, Area administration rates vary. For example, Albuquerque Area is reaching nearly 100 percent administration rate which may be due to vaccine overfill in the vials for both Pfizer and Moderna products. In accordance with FDA guidance, all available full doses may be administered.
| Area | Total Doses Distributed* | Total Doses Administered** |
|---|---|---|
| Albuquerque | 131,065 | 127,573 |
| Bemidji | 151,235 | 119,626 |
| Billings | 59,995 | 42,696 |
| California | 220,205 | 146,274 |
| Great Plains | 125,730 | 84,371 |
| Nashville | 89,955 | 68,602 |
| Navajo | 249,605 | 221,612 |
| Oklahoma City | 440,160 | 353,746 |
| Phoenix | 172,900 | 142,997 |
| Portland | 95,745 | 72,276 |
| Tucson^ | 12,070 | 8,053 |
| Grand Total | 1,748,665 | 1,387,826 |
*Distributed Data Source: IHS National Supply Service Center, includes total doses ordered and anticipated to be delivered by June 4, 2021.
**Administered Data Source: CDC Clearinghouse data from Vaccine Administration Management System (VAMS) and IHS Central Aggregator Service (CAS). Data in the CDC Clearinghouse reflects prior day data. Data may be different than actual data as there are known CDC data lags and ongoing quality review of data including resolving data errors.
^The Tucson Area vaccine administration data is currently being validated.
Note: Alaska Area – all tribes chose to receive COVID-19 vaccine from the State of Alaska.
Source: Indian Health Service (https://www.ihs.gov/coronavirus)

Indian Health Service Announces New Deputy Director for Quality Health Care and Enterprise Risk Management (Indian Health Service)
Federal Emergency Management Agency (FEMA)
White House Office of Management and Budget (Joe Biden Administration)
Tuba City Regional Health Care Corporation (Arizona, Navajo Nation)
Oklahoma City Indian Clinic (OKCIC)
Indian Health Service (Department of Health and Human Services)
Navajo Nation Town Hall (Arizona, New Mexico, Utah)
Navajo Nation (Arizona, New Mexico, Utah)
Tribal organizations statement on advance appropriations for Indian Health Service
Indian Health Service Statement on Advance Appropriations (Department of Health and Human Services)
Indian Health Service (Department of Health and Human Services)
Indian Health Service (Department of Health and Human Services)
Navajo Nation (Arizona, New Mexico, Utah)
Indian Health Service (Department of Health and Human Services)