The Indian Health Service has updated its coronavirus data, showing COVID-19 vaccination distribution and administration as of July 4, 2021.
According to the data, the IHS has distributed 1,759,715 COVID-19 vaccine doses across 11 areas of Indian Country. Of that amount, 1,448,281 have been administered, representing 82.3 percent of the total.
The number of vaccines distributed by the IHS increased by 0.3 percent from the week prior, according to the figures. Meanwhile, the number of vaccines administered increased by 0.7 percent.
The Oklahoma City Area continues to account for the most vaccines received (441,410) and administered (366,102). The Navajo Area comes in second (252,305 distributed, 232,644 administered) while the California Area comes in third (221,055 distributed, 153,713 administered).
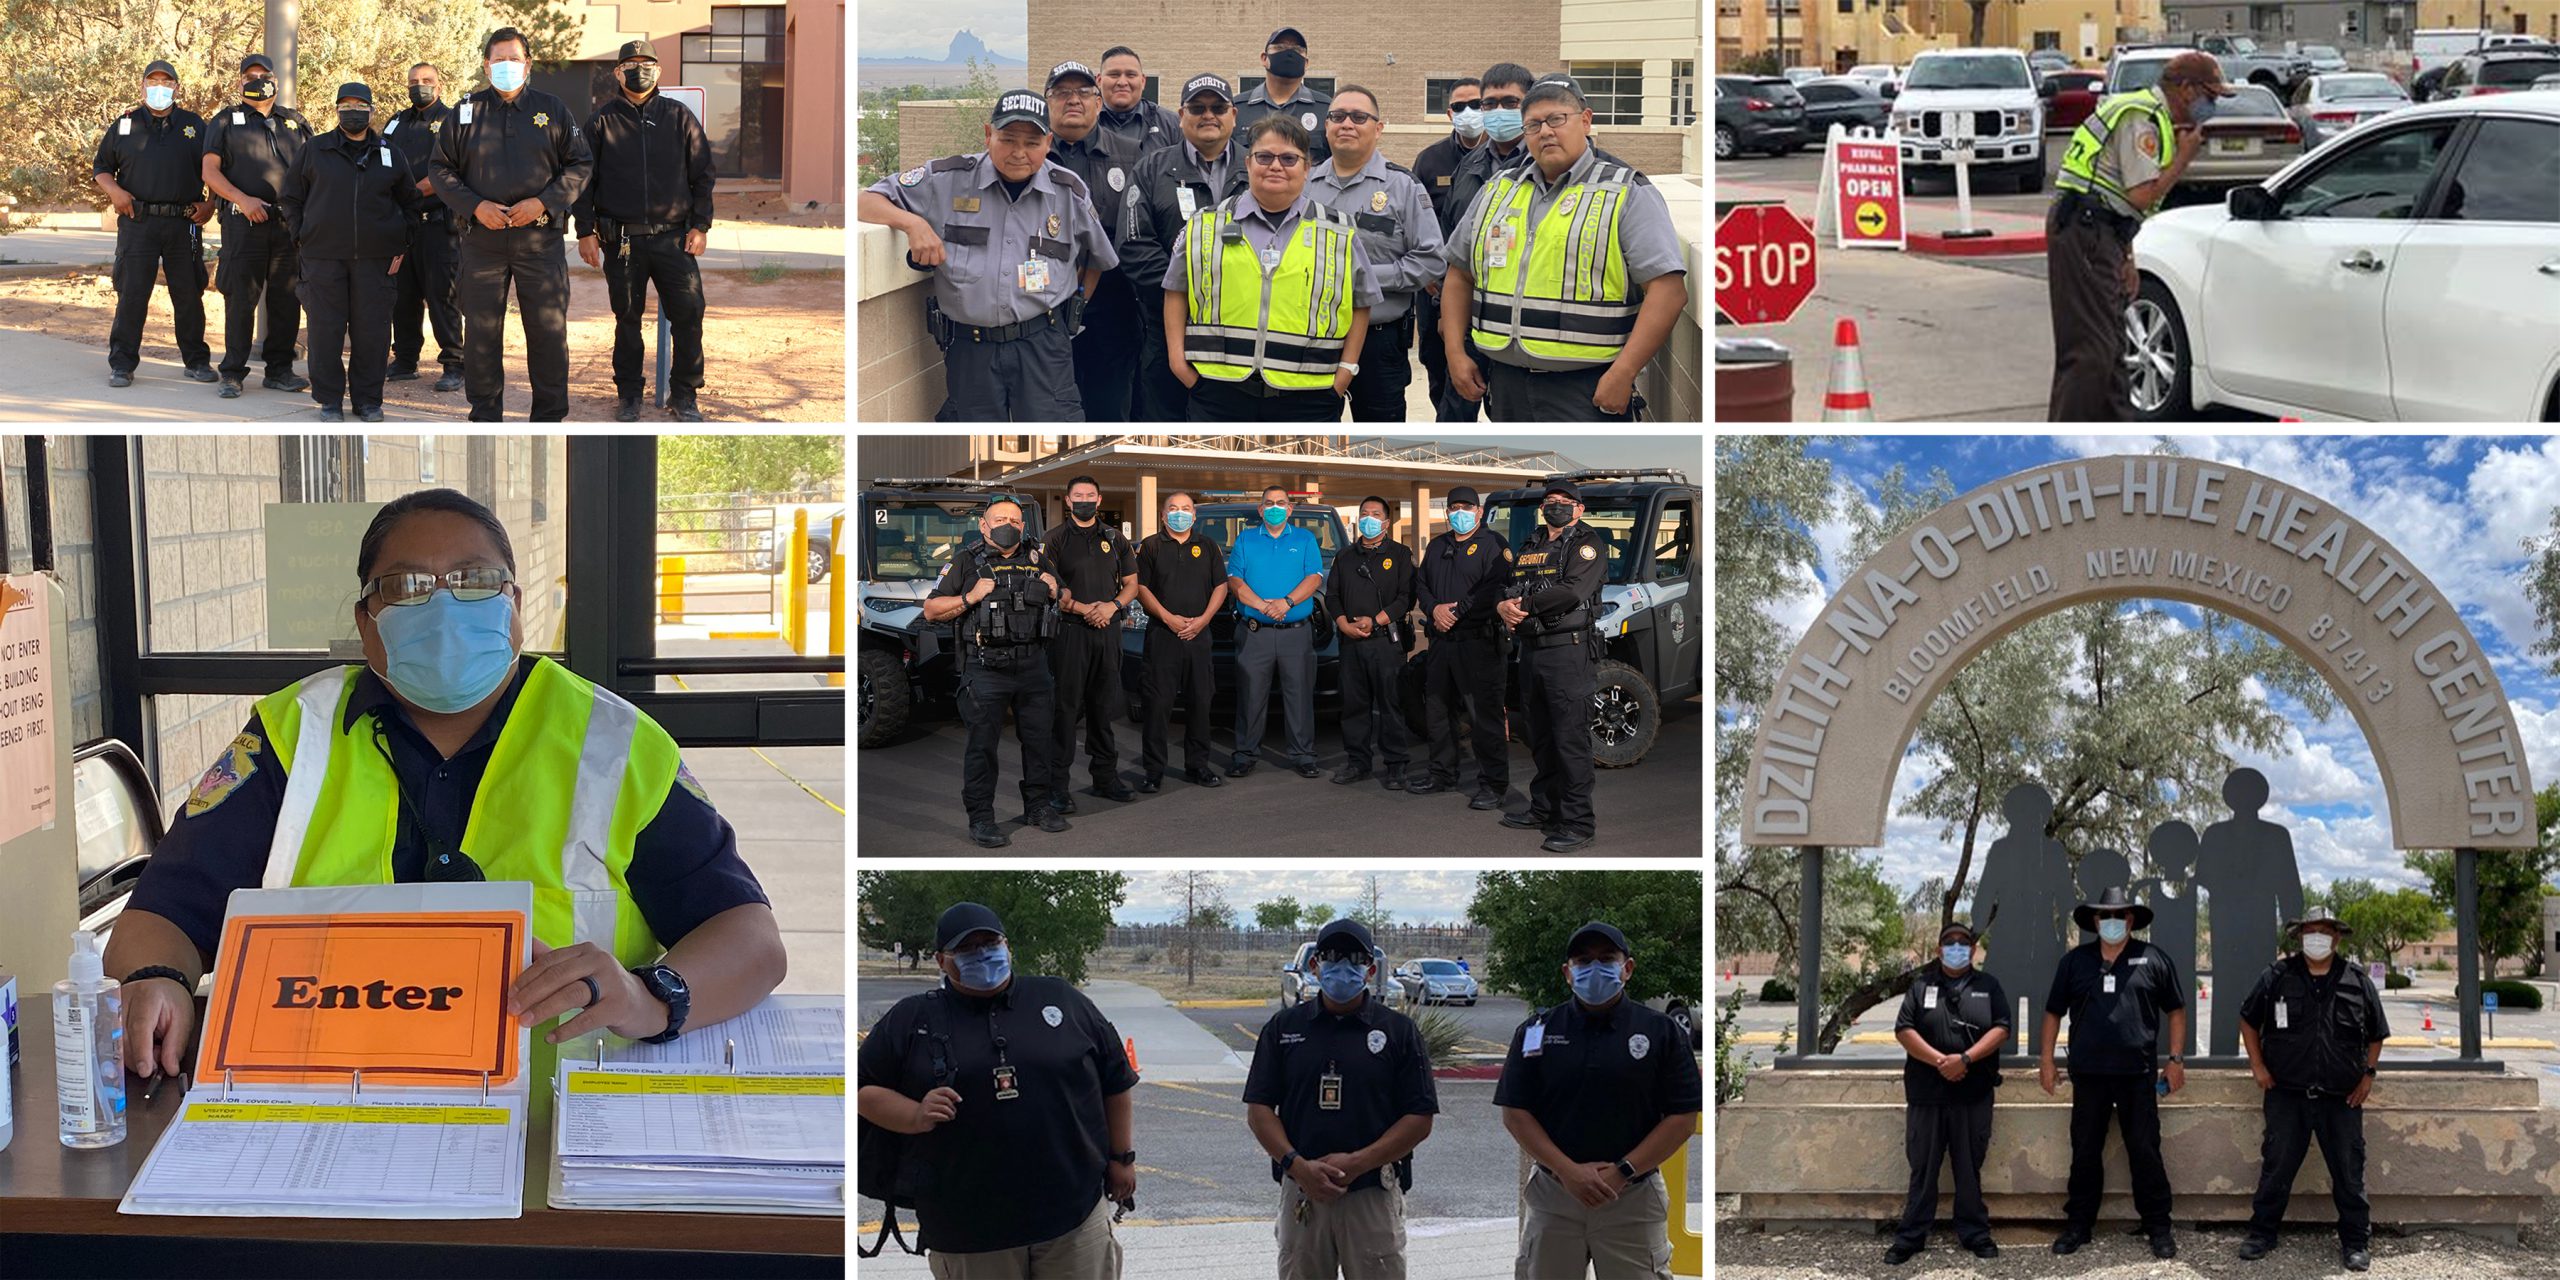
Thank you to all security personnel across the Indian health system for your efforts to safeguard our patients, employees, visitors & facilities. Our security guards are highly trained individuals who help promote a safe & comfortable environment at facilities in #IndianCountry. pic.twitter.com/JxxbQDGP18
— IndianHealthService (@IHSgov) July 2, 2021
According to the IHS, vaccination distribution and administration will be updated weekly across the 11 areas that are receiving doses directly from the agency.
Tribal health facilities in Alaska have chosen to receive their COVID-19 vaccine supplies from the state, so their region is not included in the data.
COVID-19 Vaccine Distribution and Administration by IHS Area
As of July 4, 2021, the IHS is distributing vaccine allocations of the Pfizer and Moderna vaccines. The Johnson & Johnson/Janssen vaccines are currently on backorder, but redistribution from other sites will be coordinated if sites request this vaccine. The table below shows the total number of vaccine doses distributed and administered per IHS Area to date, including COVID-19 vaccinations administered to all ages authorized for emergency use by the Food and Drug Administration (FDA). The IHS administration rate is 82 percent. Some Areas, for example, Albuquerque Area, exceeds 100 percent administration rate, which may be due to vaccine overfill in the vials for both Pfizer and Moderna products.The IHS jurisdiction is administering all available full doses in accordance with FDA guidance.
| Area | Total Doses Distributed* | Total Doses Administered** |
|---|---|---|
| Albuquerque | 131,165 | 133,102 |
| Bemidji | 152,235 | 123,492 |
| Billings | 60,895 | 45,270 |
| California | 221,055 | 153,713 |
| Great Plains | 127,080 | 89,712 |
| Nashville | 90,905 | 71,275 |
| Navajo | 252,305 | 232,644 |
| Oklahoma City | 441,410 | 366,102 |
| Phoenix | 174,050 | 149,249 |
| Portland | 96,545 | 75,356 |
| Tucson | 12,070 | 8,366 |
| Grand Total | 1,759,715 | 1,448,281 |
*Distributed Data Source: IHS National Supply Service Center, includes total doses ordered and anticipated to be delivered by July 2, 2021.
**Administered Data Source: CDC Clearinghouse data from Vaccine Administration Management System (VAMS) and IHS Central Aggregator Service (CAS). Data in the CDC Clearinghouse reflects prior day data. Data may be different than actual data as there are known CDC data lags and ongoing quality review of data including resolving data errors.
Note: Alaska Area – all tribes chose to receive COVID-19 vaccine from the State of Alaska.
Source: Indian Health Service (https://www.ihs.gov/coronavirus)

Indian Health Service Announces New Deputy Director for Quality Health Care and Enterprise Risk Management (Indian Health Service)
Federal Emergency Management Agency (FEMA)
White House Office of Management and Budget (Joe Biden Administration)
Tuba City Regional Health Care Corporation (Arizona, Navajo Nation)
Oklahoma City Indian Clinic (OKCIC)
Indian Health Service (Department of Health and Human Services)
Navajo Nation Town Hall (Arizona, New Mexico, Utah)
Navajo Nation (Arizona, New Mexico, Utah)
Tribal organizations statement on advance appropriations for Indian Health Service
Indian Health Service Statement on Advance Appropriations (Department of Health and Human Services)
Indian Health Service (Department of Health and Human Services)
Indian Health Service (Department of Health and Human Services)
Navajo Nation (Arizona, New Mexico, Utah)
Indian Health Service (Department of Health and Human Services)